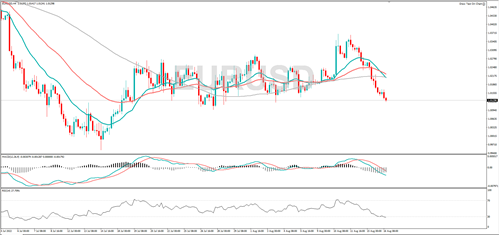
EUR/USD is in a downtrend and the MACD indicator shows that momentum is negative, implying the bears are in control. If the price decline continues, it might find support at 1.0095 or 1.0000. A rebound could see it hit 1.0251 or 1.0324.
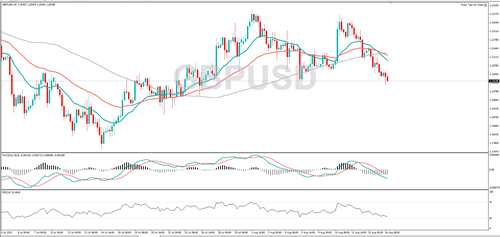
GBP/USD is under pressure, negative momentum is increasing, and RSI is falling, and that underlines the bearish move. Support might be found at 1.1889 or 1.1847. A rebound might run into resistance at 1.2113 or 1.2147.
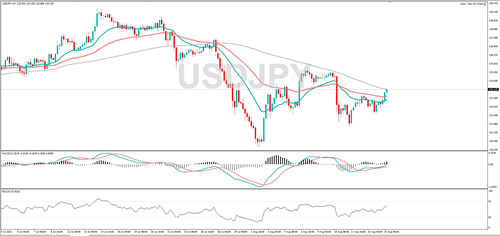
USD/JPY is edging higher and the MACD indicator shows that momentum is positive, implying the buyers are in control. 135.06 or 135.57 might act as resistance. A fall from here could see it find support at 132.54 or 131.70.
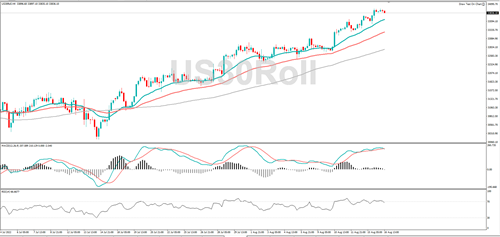
The Dow Jones is trending higher, and it printed a fresh three month high. If the rally continues, it might encounter resistance at 34105 or 34726. The RSI is in overbought territory, and that could be a sign the upward move is overstretched, a pullback might find support at 33516 or 33283.
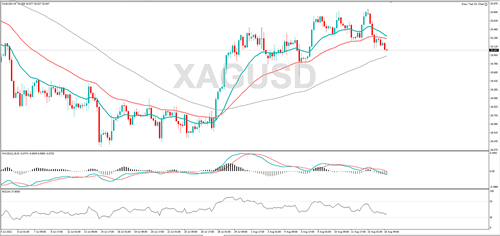
Silver has declined and negative momentum is increasing, and that indicates the bears are in control. If the downtrend continues, 19.77 or 19.53 could act as support. A rebound might target 20.86 or 21.04.
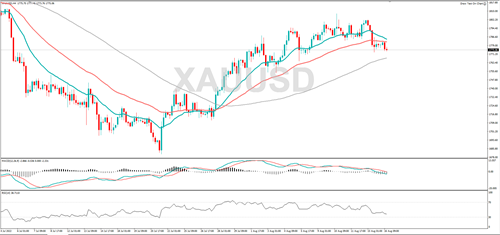
Gold is falling and RSI is in decline too, suggesting the price bias is to the downside. If the sell off continues, it might target 1764 or 1754. If the metal rallies from here, it could retest 1792, and a break above that level could bring 1800 into play.
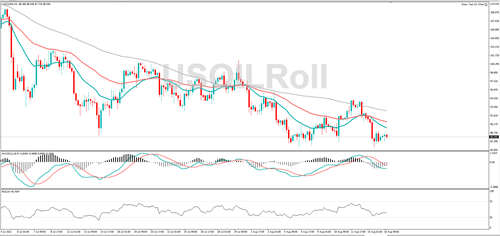
WTI is trending lower, and RSI is also falling, suggesting the price bias is to the downside. If the bearish move continues, 86.37 or 83.33 could act as support. Resistance might be found at 90.77 or 92.16.